Our MapThe Shortchanged ProjectTracking Public Investment in Early Learning
Our Research
About the Project
The Shortchanged Project aims to analyze all early learning funding streams together and chronicle how much – or little – we spend on the care and education of children before they enter elementary school nationally, state-by-state, and over time. This varies considerably among states, which the Shortchanged Project also captures (see our map tab for state specific expenditures). However, in every state, early learning remains shortchanged.
The Numbers
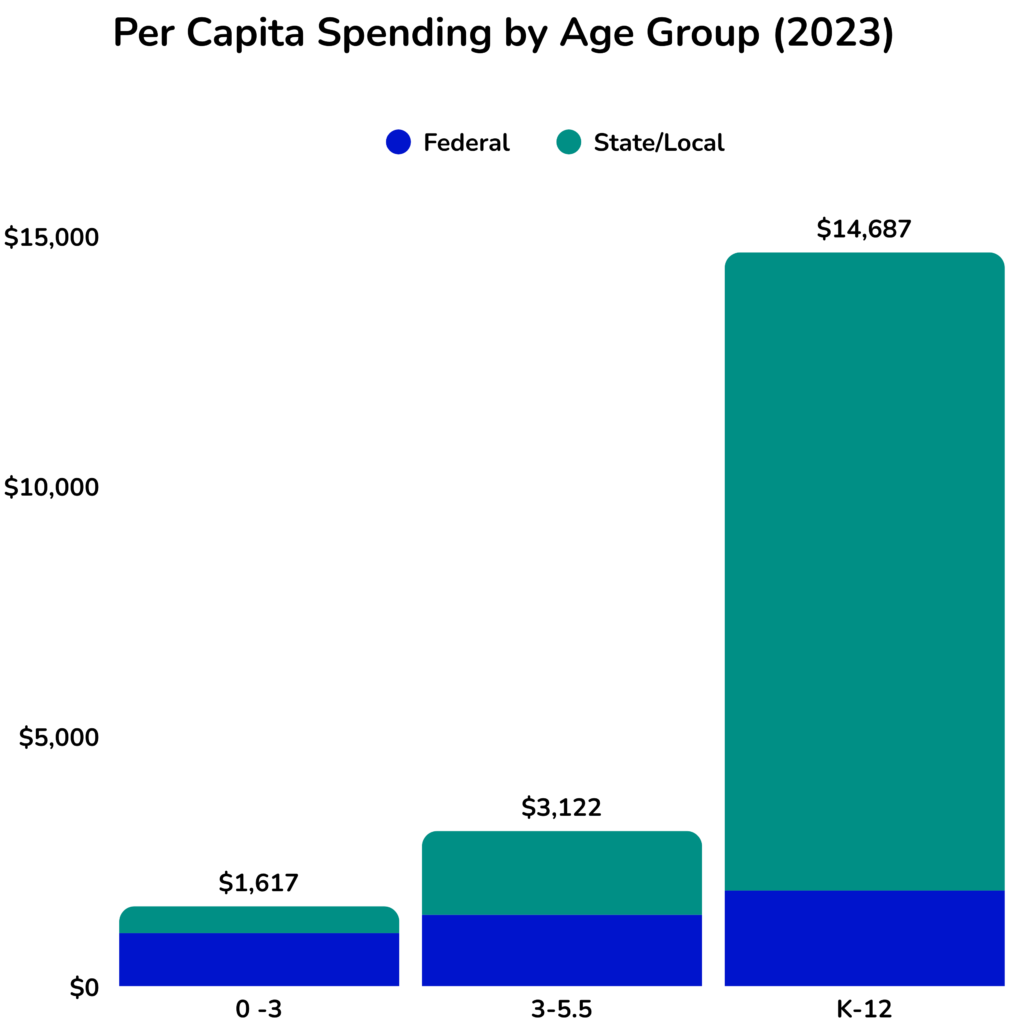
The differences found in investments in children before and after they enter kindergarten are stark. At the national level, for every dollar spent on a child during their K-12 years, only 11 cents were spent on infants and toddlers and 21 cents were spent on preschoolers. The graph to the left shows wide disparities in public care and education spending by age group.
Tracking Funding
Tracking early learning funding is no small task. Though politicians and media often talk about “preschool” or “child care” as one cohesive birth-to-five policy system – and in an ideal world it would be – the way early learning is funded in the U.S. has created a fractured system that is exceptionally hard to capture in raw numbers. Child care is funded and administered differently than public Pre-K. Public Pre-K is funded and administered differently than Head Start. Early Head Start is funded and administered differently than home visiting, and so on. These publicly funded programs are run by different federal and state agencies, with separate goals, rules, and reporting systems that do not translate easily to one another, even though children are frequently served by multiple funding streams simultaneously. The Shortchanged Project takes a significant step towards creating an accurate account of the sum total of public funding spent on early care and education in the U.S.
How we define public early care and education spending
We analyzed federal, state, and local funding streams that support child care, preschool, home visiting, early intervention, and special education services for children from birth to kindergarten entry. To isolate early care and education, we excluded from our analyses other essential funding for children’s development like family nutrition assistance, housing, and healthcare. Importantly, we also excluded COVID relief dollars used to support the early care and education field from our analysis as these funds were temporary in most cases.
Why we use per capita spending
We analyzed funding streams by the number of children living in each state in each age group, rather than by the number of children served by each program. This analytical choice reflects CELFE’s belief that every child born in the U.S. should have access to appropriate early learning experiences, just as every child has access to public education. Though not every family chooses public school, every child can enroll. The same should be true for families with young children.
How we designate age groups
We disaggregated funding streams based on the following age groupings: infants and toddlers (birth to third birthday), preschoolers (ages three to five years, six months), and children in the K-12 years (ages five years, six months to eighteen years, six months). Rather than assume all five-year-olds – or no five-year-olds – are served in the early childhood system, we split this birth cohort in half to more accurately represent when children enter kindergarten and are therefore served by different funding systems.
Why we use 2023 data
This is the latest consistently available data for every federal funding stream we analyze. CELFE will update these analyses as more recent data becomes available
What we mean by actual state spending
We located expenditure budgets for each state and reviewed them line by line to determine the real total state spending (above federal spending, state-reported matches, and maintenance of efforts, as well as NIEER’s state/local preschool analysis). We validated state data when possible and will continue to verify and update it as needed.
How we rank state investments
To account for variations in cost of living, population, social and political contexts, and other differences across states, we analyzed the ratios of state and local per capita spending by age group compared to per capita K-12 investments. We then ranked the states according to how close or far away their per capita ECE investments are from their K-12 investments.
The Shortchanged Project is made possible by the generous support of the Heising-Simons Foundation, the Bainum Family Foundation, and the Saul Zaentz Charitable Foundation.